Top 5 Chart Patterns Every Trader Should Know
Introduction
Chart patterns are essential tools in technical analysis, helping traders predict market movements based on historical price action. Whether you’re a beginner or an experienced trader, understanding these patterns can improve your trading decisions and strategy. Here are the top five chart patterns every trader should know.
1. Head and Shoulders Pattern
Description:
The Head and Shoulders pattern signals a potential reversal in the market. It consists of three peaks: a higher peak (the head) between two lower peaks (the shoulders).
How to Trade It:
- Entry: Enter a trade when the price breaks below the neckline (support level).
- Target: Measure the height from the head to the neckline and project it downward.
- Stop Loss: Place above the right shoulder for risk management.
✅ Indicates: Bearish reversal (standard) or bullish reversal (inverse Head and Shoulders).
2. Double Top and Double Bottom
Description:
- Double Top: A bearish reversal pattern that forms after an uptrend when the price fails to break above a resistance level twice.
- Double Bottom: A bullish reversal pattern that occurs when the price hits a support level twice without breaking lower.
How to Trade It:
- Entry: Trade the breakout of the neckline (support for double top, resistance for double bottom).
- Target: Measure the distance between the peaks/troughs and project it after the breakout.
- Stop Loss: Above resistance (for double top) or below support (for double bottom).
✅ Indicates: Reversal of the current trend.
3. Triangle Patterns (Ascending, Descending, and Symmetrical)
Description:
Triangles are continuation patterns that indicate a potential breakout. There are three main types:
- Ascending Triangle: Bullish pattern with a horizontal resistance line and rising support.
- Descending Triangle: Bearish pattern with a horizontal support line and declining resistance.
- Symmetrical Triangle: Consolidation pattern where price forms lower highs and higher lows, leading to a breakout in either direction.
How to Trade It:
- Entry: Wait for a breakout above resistance (bullish) or below support (bearish).
- Target: Measure the widest part of the triangle and project it in the breakout direction.
- Stop Loss: Place below the support line (ascending) or above resistance (descending).
✅ Indicates: Continuation of the trend or breakout direction.
4. Flag and Pennant Patterns
Description:
- Flags and Pennants are short-term continuation patterns that appear after strong price movements.
- Flag: A rectangular consolidation after a sharp trend.
- Pennant: A small symmetrical triangle after a sharp price move.
How to Trade It:
- Entry: Enter after price breaks out of the pattern in the same direction as the trend.
- Target: Measure the flagpole’s height and project it after the breakout.
- Stop Loss: Place below (bullish) or above (bearish) the consolidation zone.
✅ Indicates: Continuation of the prevailing trend.
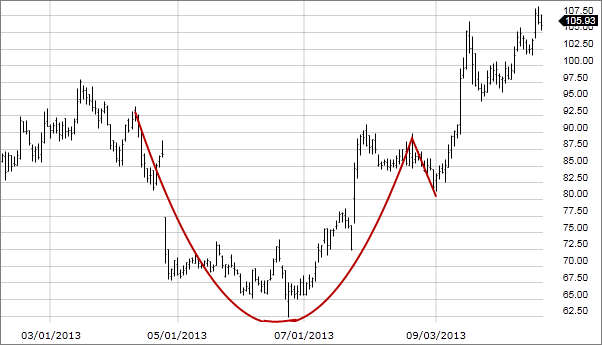
5. Cup and Handle Pattern
Description:
The Cup and Handle is a bullish continuation pattern resembling a tea cup, with a rounded bottom (cup) followed by a smaller consolidation (handle) before breaking out.
How to Trade It:
- Entry: Buy when price breaks out of the handle’s resistance.
- Target: Measure the depth of the cup and project it upwards.
- Stop Loss: Place below the handle’s low.
✅ Indicates: Bullish continuation.
Conclusion
Mastering these five chart patterns can significantly improve your trading strategy. Whether identifying reversals or continuations, recognizing these formations helps traders make informed decisions.
📌 Tip: Always confirm patterns with additional indicators like volume, moving averages, and RSI for higher probability trades!
🚀 Start analyzing these patterns today and improve your trading game!
A+
Thank you for the info!
I would add Bollinger Bands here, to your AI tools, could be a nice compliment to RSI!
Fabulous insights